
Disclosure Information
This blog contains affiliate links. If you make a purchase through one of these links, our team may earn a commission at no extra cost to you. Learn more. Thanks for your support!
The fitness industry is undergoing significant transformation, driven by evolving workout preferences and the latest technological innovations.
Drawing from a comprehensive range of industry and health reports, we’ve compiled a detailed statistical analysis. Here are the key trends and figures shaping the fitness landscape in 2025.
Let’s jump in!
Global Health & Physical Activity Levels
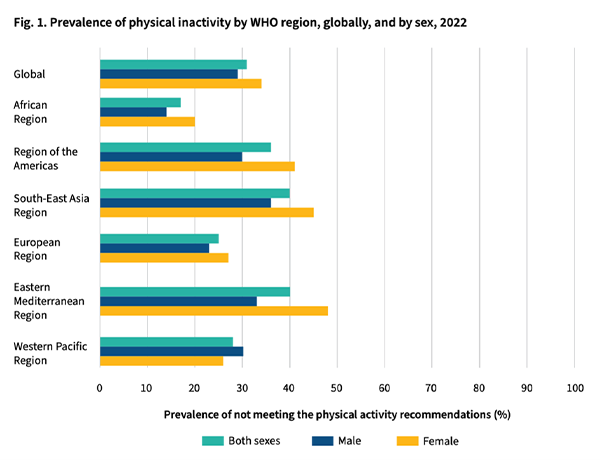
- Globally, 31% of adults did not meet the WHO recommended levels of physical activity in 2022, an increase of about 5 percentage points between 2010 and 2022. This equates to roughly 1.8 billion people. (Source, Source)
- Globally, women remain less active than men by an average of 5 percentage points, a gap that has not changed since 2000. (Source)
- Physical inactivity levels increase significantly after the age of 60 for both men and women. (Source)
- Globally, 81% of the world’s adolescent population (aged 11-17) is insufficiently physically active (doing less than 60 minutes of moderate to vigorous activity per day). (Source, Source)
- Adolescent girls are generally less active than adolescent boys (85% vs. 78% not meeting guidelines). (Source, Source)
- For younger children (under 5), early childhood is a critical period for forming healthy habits regarding physical activity, sedentary behaviour, and sleep. (Source)
- A global study found only 14% of preschoolers (3-4 years old) met the combined WHO guidelines for physical activity (≥180 mins/day, including 60 mins moderate-vigorous), sedentary screen time (<1 hour/day), and sleep (10-13 hours/day). (Source, Source)
- Looking individually at preschoolers globally: 49% met physical activity recommendations, 42% met screen time recommendations, and 81% met sleep recommendations. (Source)
- Another study using step counts found approximately 31% of 3-4 year olds met the total physical activity guideline (based on ≥11,500 steps/day). (Source)
- The WHO aims for a 15% relative reduction in the global prevalence of physical inactivity in adults and adolescents by 2030 (compared to a 2010 baseline). However, based on current trends (increase from 2010 to 2022), the world is off track, and inactivity is projected to rise to 35% by 2030 if trends continue. (Source, Source)
- Physical inactivity is one of the leading risk factors for noncommunicable diseases (NCDs) mortality. People insufficiently active have a 20% to 30% increased risk of death compared to those who are sufficiently active. (Source)
- Physical inactivity is linked to an increased risk of conditions like heart disease, stroke, type 2 diabetes, hypertension, dementia, depression, and certain cancers (e.g., breast, colon). (Source, Source)
- The estimated global cost of physical inactivity to public health systems is projected to be approximately US$27 billion per year between 2020 and 2030 — totaling around US$300 billion over the decade if current levels persist. (Source, Source)
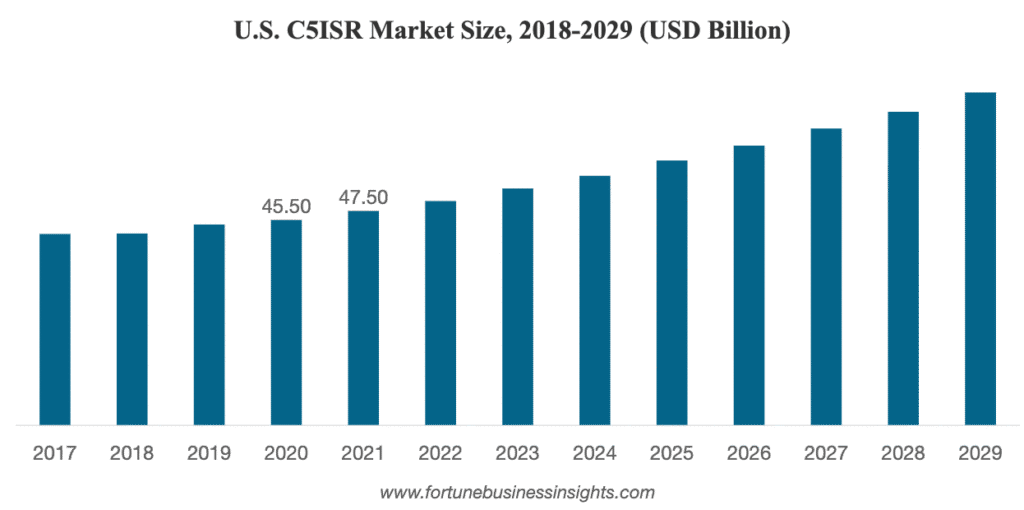
- A 2023 Lancet study estimated the annual global cost of physical inactivity at US$47.6 billion per year, projecting nearly 500 million new cases of preventable NCDs globally between 2020 and 2030 due to inactivity. (Source, Source)
- Higher amounts of sedentary behaviour (low energy expenditure while awake, like sitting or screen time) are associated with poor health outcomes, including increased adiposity and poorer cardiometabolic health in children/adolescents. (Source)
National & Regional Physical Activity Levels
USA:

- According to 2022 NHIS data, only 24.3% of US adults met the Physical Activity Guidelines for Americans for both aerobic and muscle-strengthening activities. (Source, Source)
- Analysis of the 2020 NHIS found that 46.9% of US adults met the guidelines for aerobic activity (this includes those who also met muscle-strengthening guidelines). (Source, Source)
- In 2020, 22.7% of US adults met only the aerobic activity guidelines. (Source)
- In 2020, only 6.8% of US adults met only the muscle-strengthening guidelines. (Source)
- Based on 2020 NHIS data, men (28.3%) were more likely than women (20.4%) to meet guidelines for both aerobic and muscle-strengthening activity. (Source)
- Guideline adherence decreases with age. In 2020, 41.3% of men aged 18-34 met both guidelines, compared to 15.3% of men aged 65+. For women, it was 28.7% (18-34) versus 10.8% (65+). (Source)
- Data from a 2019 nationwide survey using detailed previous-day recalls estimated that US adults spend an average of 9.5 hours per day in sedentary behavior (considerably higher than estimates from single-question surveys). Leisure time accounted for nearly half (4.3 hours) of this sedentary time. (Source, Source)
- Accelerometer data from middle-aged and older US adults (NHANES study) indicated an average sedentary time of 12.3 hours per day (based on a 16-hour waking day). (Source)
- According to the 2024 US Report Card on Physical Activity for Children and Youth, only 20% to 28% of children and adolescents aged 6-17 meet the recommended guideline of 60 minutes of moderate-to-vigorous physical activity daily. This earned the US an overall grade of D-. (Source, Source, Source)
- Activity levels decline with age among youth: 26% to 42% of 6-11 year-olds meet guidelines, compared to only 15% of 12-17 year-olds. (Source)
- Data from the National Survey of Children’s Health (NSCH) estimated that 53.8% of US children aged 6-17 participated in sports (on a team or took lessons) in 2022, a decrease from 58.4% in 2017. (Source, Source)
- High school sports participation (grades 9-12) saw a significant drop during the pandemic, falling to 49.1% in 2021 (a low point based on CDC YRBS data), though participation numbers rebounded somewhat in the 2022-23 school year. (Source, Source)
England/UK:
- In England (Nov 2023-24), 63.4% of adults (19+) were classified as ‘active’ (doing 150+ minutes of moderate intensity equivalent physical activity per week). (Source)
- 25.2% of adults in England (Nov 2023-24) were ‘inactive’ (doing less than 30 minutes per week). (Source)
- In the London Borough of Sutton (2023/24), 70.5% of adults were physically active, higher than the England average (63.1%) and London average (65.9%) for that period. (Source)
- 18.6% of adults in Sutton were physically inactive, lower than the England (25.8%) and London (23.7%) averages for 2023/24. (Source)
- In the UK (2024/25 data), 89% of people who exercise do so at least once per week. 39% exercise two to three times per week. (Source)
- Summer is the most popular exercise season in the UK, while 76% choose not to exercise during winter. (Source)
- In the UK (2022-23 academic year), 47% of children and young people met the Chief Medical Officers’ guidelines (average 60+ mins/day). This level is stable compared to pre-pandemic but inequalities persist. (Source)
- UK children from the least affluent families (44%) are less likely to meet activity guidelines than those from the most affluent (55%). Girls (44%) are less active than boys (51%). (Source)
- A UK study found 76% of adults reported that they understand that being active helps their mental health. (Source)
Europe (WHO European Region):
- 81.8%: The average proportion of the 23 HEPA monitoring framework indicators achieved by EU Member States in 2024. (Source)
- 45%: Percentage of Europeans (≥ 15 years) reporting they never exercised or played sports (an increase from 39% in 2009, according to cited Eurobarometer data). (Source)
- 31%: Percentage of Europeans reporting they never engaged in other (non-sport) physical activity (cited Eurobarometer data). (Source)
- 96%: EU countries reporting having estimates for physical activity levels in children and adolescents (Indicator 3). (Source)
- 85%: EU countries with official national recommendations on physical activity for health (Indicator 1). (Source)
- 93%: EU countries allocating specific funding for HEPA promotion (Indicator 5). (Source)
- 78%: EU countries with a national coordination mechanism for HEPA promotion (Indicator 4). (Source)
Africa:
- Sub-Saharan Africa (SSA) shows relatively lower levels of adult inactivity compared to global averages, with an age-standardized prevalence of 16.8% in 2022. SSA is noted as potentially on track to meet the WHO’s 2030 reduction target, though challenges remain. (Source)
- Insufficient physical activity affects nearly one-third (31.3%) of adults globally (2022), an increase since 2010. (Source)
- National prevalence of insufficient activity among adults varies significantly within East Africa, with cited examples ranging from 7% (Kenya) to 37.6% (Uganda). (Source)
- A high pooled crude prevalence of 52.0% of Nigerian adults were physically inactive. (Source)
- In Nigeria, women (55.8%) were more likely to be inactive than men (49.3%). (Source)
- In Nigeria, inactivity was significantly higher in urban settings (56.8%) compared to rural areas (18.9%). (Source)
- In Nigeria, the estimated number of inactive adults (aged 20-79) surged by 240% between 1995 (14.4 million) and 2020 (48.6 million). (Source)
Canada:
- In 2021, 57% of Canadian men (18+) and 51% of women (18+) reported being physically active for 150 minutes per week. (Source)
- 49% of Canadian adults (18+) meet national guidelines of 150 minutes of moderate-to-vigorous physical activity weekly. (Source)
- 39% of Canadian kids and teens (5-17 years) meet guidelines of 60 minutes daily. Boys (52%) are twice as likely as girls (26%) to meet these guidelines. (Source)
- 62% of Canadian young children (3-4 years) meet their national physical activity guidelines. (Source)
- Canadian adults spend an average of 9.6 hours per day sedentary (excluding sleep); children and youth spend 8.4 hours/day sedentary. (Source)
- The economic impact of physical inactivity in Canada is estimated at CAD $3.9 billion annually. (Source)
- During the pandemic, activity levels for Canadian boys dropped then rebounded higher than pre-pandemic by 2021-22; girls’ levels dropped and only partially recovered. (Source)
Australia:
- Older data (2021, Dept. of Health) suggested over half (55%) of Australian adults and 2 in 3 children (70%, ages 2-17) did not meet guidelines. Only 2% of teens (13-17) met guidelines. (Source)
- Physical inactivity is responsible for over 6% of Australia’s cancer burden (second only to smoking). (Source)
- In NSW (2023), 65% of adults met requirements of 150+ mins moderate/vigorous activity AND ≥5 sessions/week. 7.6% were inactive (no moderate/vigorous activity). (Source)
- The proportion of Australians classified as sedentary increased by 8.3% points due to COVID-19 lockdowns. (Source)
- The decline in physical activity during COVID-19 was forecast to have a $1.5 billion impact on the Australian healthcare system. (Source)
Other Regions/Countries:
- Malta’s HEPA Strategy (2025-2030) sets national targets to increase physical activity across age groups. (Source)
- The UAE & KSA Health & Fitness Report highlights growth drivers and participation trends in these specific Gulf nations. (Source)
- Mauritius Health Statistics Report 2023 likely contains data on NCD prevalence potentially linked to inactivity. (Source)
Fitness Industry Market & Trends
- The global wellness economy was valued at $5.6 trillion in 2022. (Source)
- The “Physical Activity” market within the wellness economy was valued at $976 billion in 2022. (Source)
- The global home fitness equipment market was valued around USD 11.3-12.26 billion in 2023/2024. (Source)
- The global home fitness equipment market is projected to grow to USD 17.2-20.56 billion by 2032-2034, with a CAGR ranging from 4.7% to 8.2%. (Source, Source)
- Cardiovascular training equipment holds the dominant share of the home fitness equipment market. (Source)
- In the US, search interest for home strength equipment grew at twice the rate of cardio equipment from 2011 to 2023 (170% vs 72%). (Source)
- The UK health and fitness market size, membership numbers, and facility counts are detailed annually. (Source)
- The global sporting goods market is projected to grow, influenced by health trends, digitalization, and sustainability. (Source)
- Key investment areas in fitness include boutique studios, hybrid fitness models (digital + physical), and wellness integration. (Source)
- Technology, including wearables, mobile apps, and gym management software, is a significant driver of industry evolution. (Source, Source)
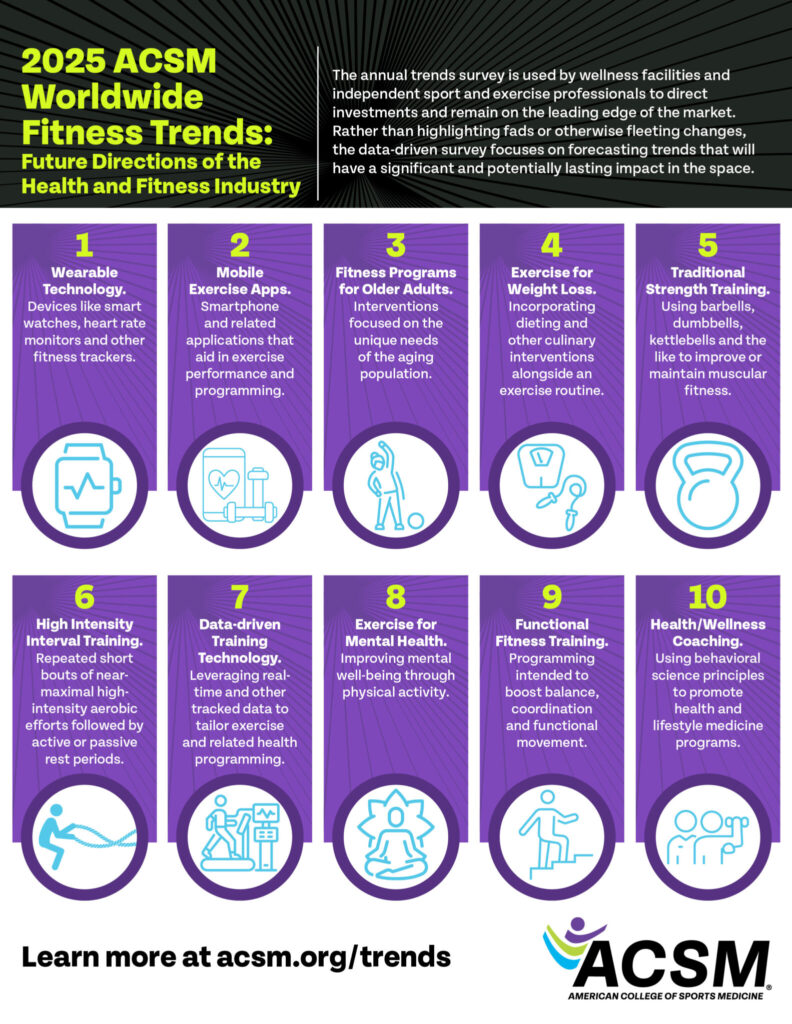
- Wearable technology was the #1 fitness trend for 2025 according to the ACSM survey. (Source)
- Mobile exercise apps ranked #6 in the 2025 ACSM trends, continuing their rise. (Source)
- Data-driven training technology was ranked #7 in the 2025 ACSM trends. (Source)
- A UK study found 10% of consumers own a smart fitness device, with another 12% planning to purchase one. Smart bikes were the most commonly owned. (Source)
- Major gym chains like Planet Fitness provide quarterly updates on financial performance and membership growth. (Source)
Consumer Behavior & Activity Choices
- Running and cycling remain highly popular activities globally, with significant participation tracked on platforms like Strava. (Source)
- Social features on fitness apps encourage activity and community building. (Source)
- Consumer spending reflects continued investment in activewear, home fitness equipment, and subscriptions. (Source, Source)
- Post-COVID, 29% of US exercisers purchased fitness equipment for home use. (Source)
- Roughly a third of US adults owned home fitness equipment as of May 2020, with 8% planning to purchase some soon. (Source)
- As of 2022, 35.6% of US exercisers cited cost as the main barrier to owning home fitness equipment. (Source)
- Building muscle was cited as the top fitness goal for 2024 (35.9%) in a US survey. (Source)
- Improving overall health (49%) and improving mental health (34%) were the top exercise goals in a 2024/25 UK survey. (Source)
- Traditional strength training ranked #5 in the 2025 ACSM fitness trends. (Source)
- The most logged exercises in the StrengthLog app (2024 data) were Bench Press (9.7%), Squat (7.0%), and Deadlift (5.0%). (Source)
- Women logged the hip thrust 830% more than men in the StrengthLog app data. (Source)
- Emerging UK fitness trends based on search increases include Somatic Exercise (+2120%), Exercise Snacking (+414%), HYROX (+306%), Boutique Fitness (+240%), and Rucking (+177%). (Source)
- Hybrid fitness (mixing virtual, in-person, and at-home) is a growing trend, with hybrid exercisers potentially working out more often. (Source, Source)
- There is a growing trend of integrating mental wellness practices (meditation, mindfulness) with physical fitness routines. (Source)
Mental Health & Physical Activity Link
- Belief in Benefits: 82% of UK adults believe regular physical activity is important for mental health and wellbeing. 45% believe doing more would improve their own mental health. (Source)
- Stress & Activity: 74% of UK adults believe physical activity can help manage stress. (Source)
- Activity Levels: 36% of UK adults do not meet the WHO physical activity recommendations. (Source)
- Barriers: Common barriers cited in the survey include weather (31%), being too tired/low energy (28%), being too busy (22%), feeling low/depressed (18%), stress (17%), anxiety (15%), and cost (14%). (Source)
- Exercise for mental health ranked #8 in the 2025 ACSM fitness trends. (Source)
Workplace Wellness Programs
- Employer wellness programs show varying effectiveness; participation rates and program design (holistic vs. limited) are key factors influencing outcomes. (Source, Source)
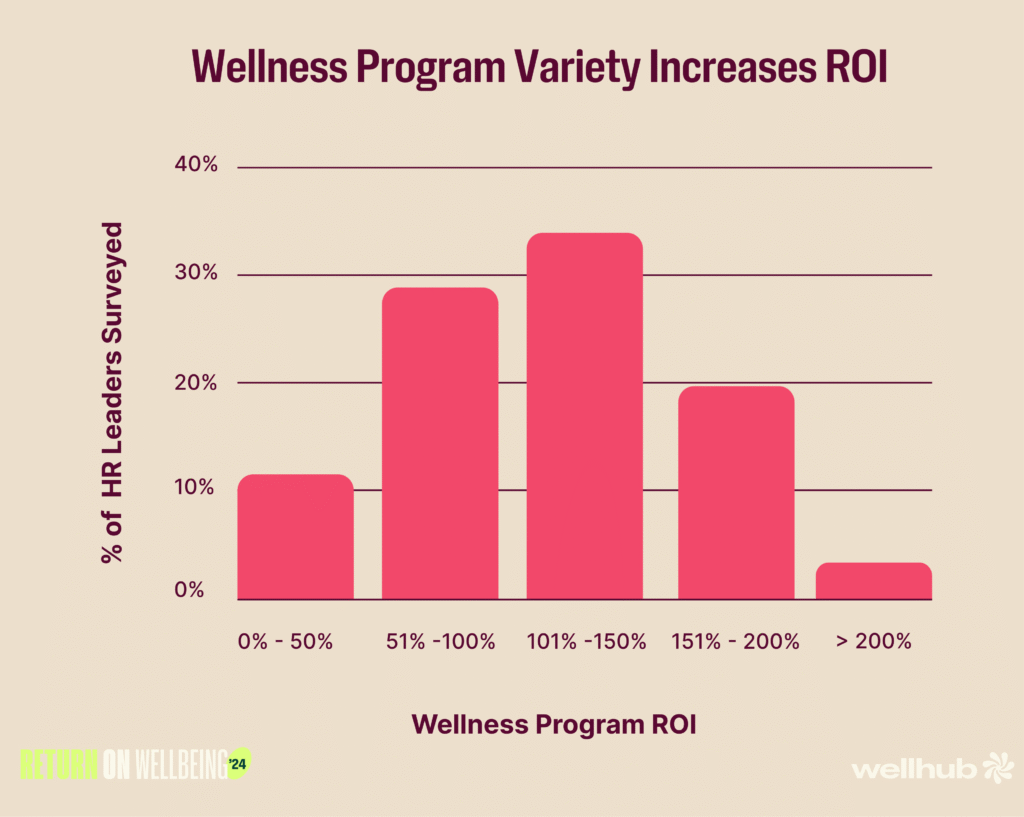
- A 2024 survey of HR leaders found 95% of companies measuring ROI see positive returns from wellness programs. (Source, Source)
- 56% of companies (in the Wellhub survey) see at least a 2X return ($2 back for every $1 spent) from their wellbeing program investment. (Source)
- Reported benefits from wellness programs (Wellhub survey) include increased productivity (99% of HR leaders agree), reduced healthcare costs (91% agree), reduced sick days (89% agree), and reduced turnover (98% agree). (Source, Source)
- Other studies suggest ROI from $1.50 to $3.00 per dollar spent, primarily due to reduced healthcare costs and increased productivity. (Source)
- Companies implementing more wellness best practices experience lower employee turnover rates (e.g., 11% lower in a Deloitte analysis citing Mercer data). (Source)
- Incentives can significantly boost participation in workplace wellness initiatives, but long-term behavior change remains a challenge. (Source)
Social Media Influence on Fitness
- Social media platforms are widely used for accessing fitness content, influencing users’ motivation and exercise habits (specific %s vary by study). (Source)
- Studies investigate the correlation between exposure to social media fitness influencers/content and users’ body image perceptions and exercise frequency. (Source)
Note: Data points reflect the information available in the linked sources or summaries thereof as of the date of publishing. Some links may point to paywalled reports or require specific access.